Most people have heard of the phrase “a picture is worth a thousand words.” We don’t want to sound like a broken record, but it certainly rings true when it comes to bringing data to life. In 2013, Google recorded more than 67,000 searches per month for the terms ‘infographic’ or ‘infographics,’ and this number has only grown over the years. It has even been proven that content with relevant images gets 94% more views than content without relevant images. (HubSpot)
Almost any information about any subject can be broken down into an infographic. If you don’t believe us, then take a look for yourself. There are infographics ranging from the breakdown of the new Star Wars movie all the way to chopstick etiquette. This range and flexibility can give companies an enormous opportunity to share their data in a compelling and exciting way.
The DreamBig team absolutely loves this new way to communicate effectively and creatively, so we decided to put together a quick list of ways to include this unique marketing trend into your everyday strategy.
Corporate Report Design
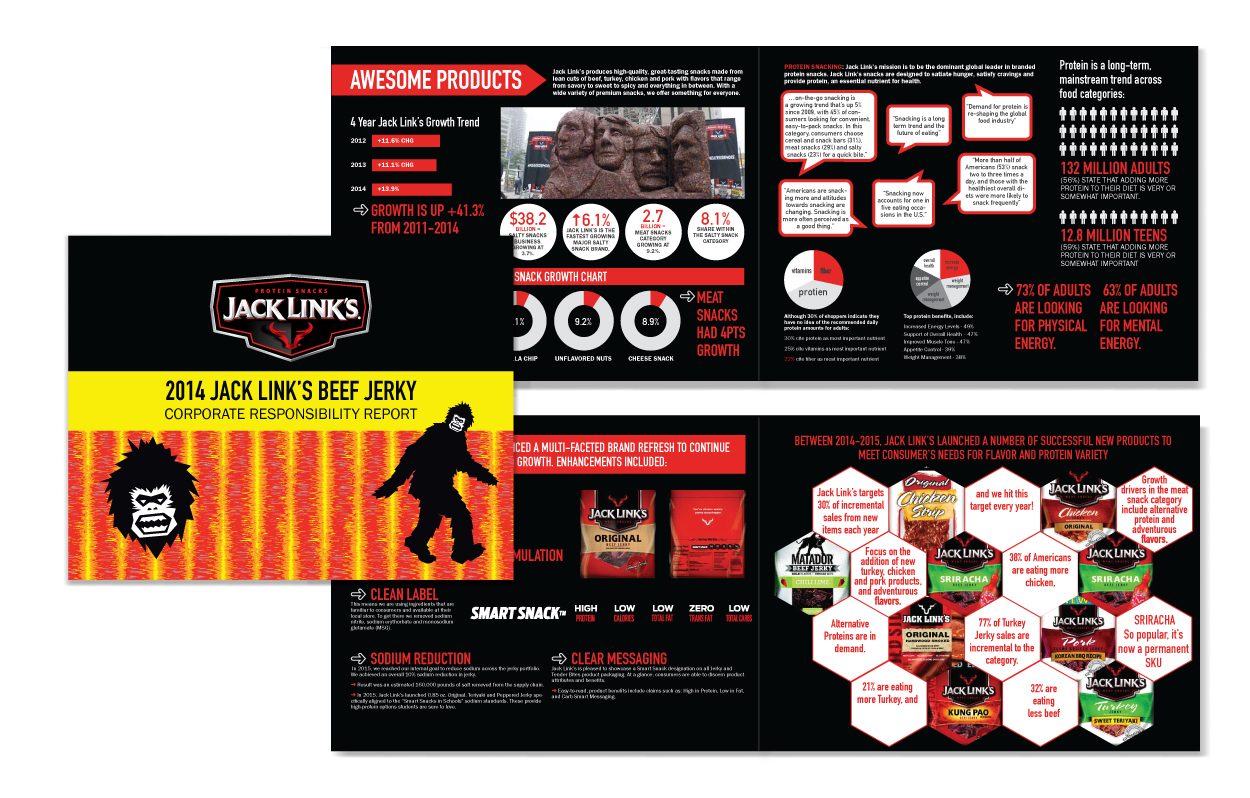
1) Corporate Reports.
40% of people will respond better to visuals than to plain text.
Whether you want to or not, your business or department may have to put together a report on the nitty-gritty details of your progress for the year. Half the time, your audience is dreading it just as much as you. Surprisingly, they don’t particularly love reading through 70 pages of data and picking out the details they needed the most. Who knew?
Instead of creating the same old boring booklet, stand out and use an infographic to pull out the most important data and isolate the key points of your document. It will minimize excess information, keep your audience interested, and most importantly, transform the topic into something exciting.

Thomson Reuters White Paper
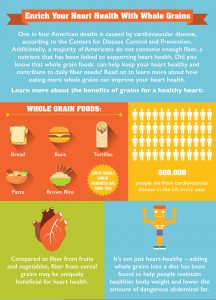
2) White Papers.
65% of the population are visual learners.
Fun fact: There’s actually a fair amount of blog articles and websites dedicated to the subject “Why white papers suck.” They’re not completely wrong, but we do believe that white papers are a crucial part of providing your customers a snapshot into your expertise. We have a better way of capturing and keeping the attention of your readers: you guessed it, infographics.
65% of people are visual learners, and you have the chance to provide them a glimpse into your expertise in an entertaining manner. Not only will the readers process visuals faster, they’re more likely to remember them too.
This is the “show and tell” for your business! Make yourself trendy and entertaining – your audience will thank you for providing them with something more than a dust collector.
Cien Tacos Web Design
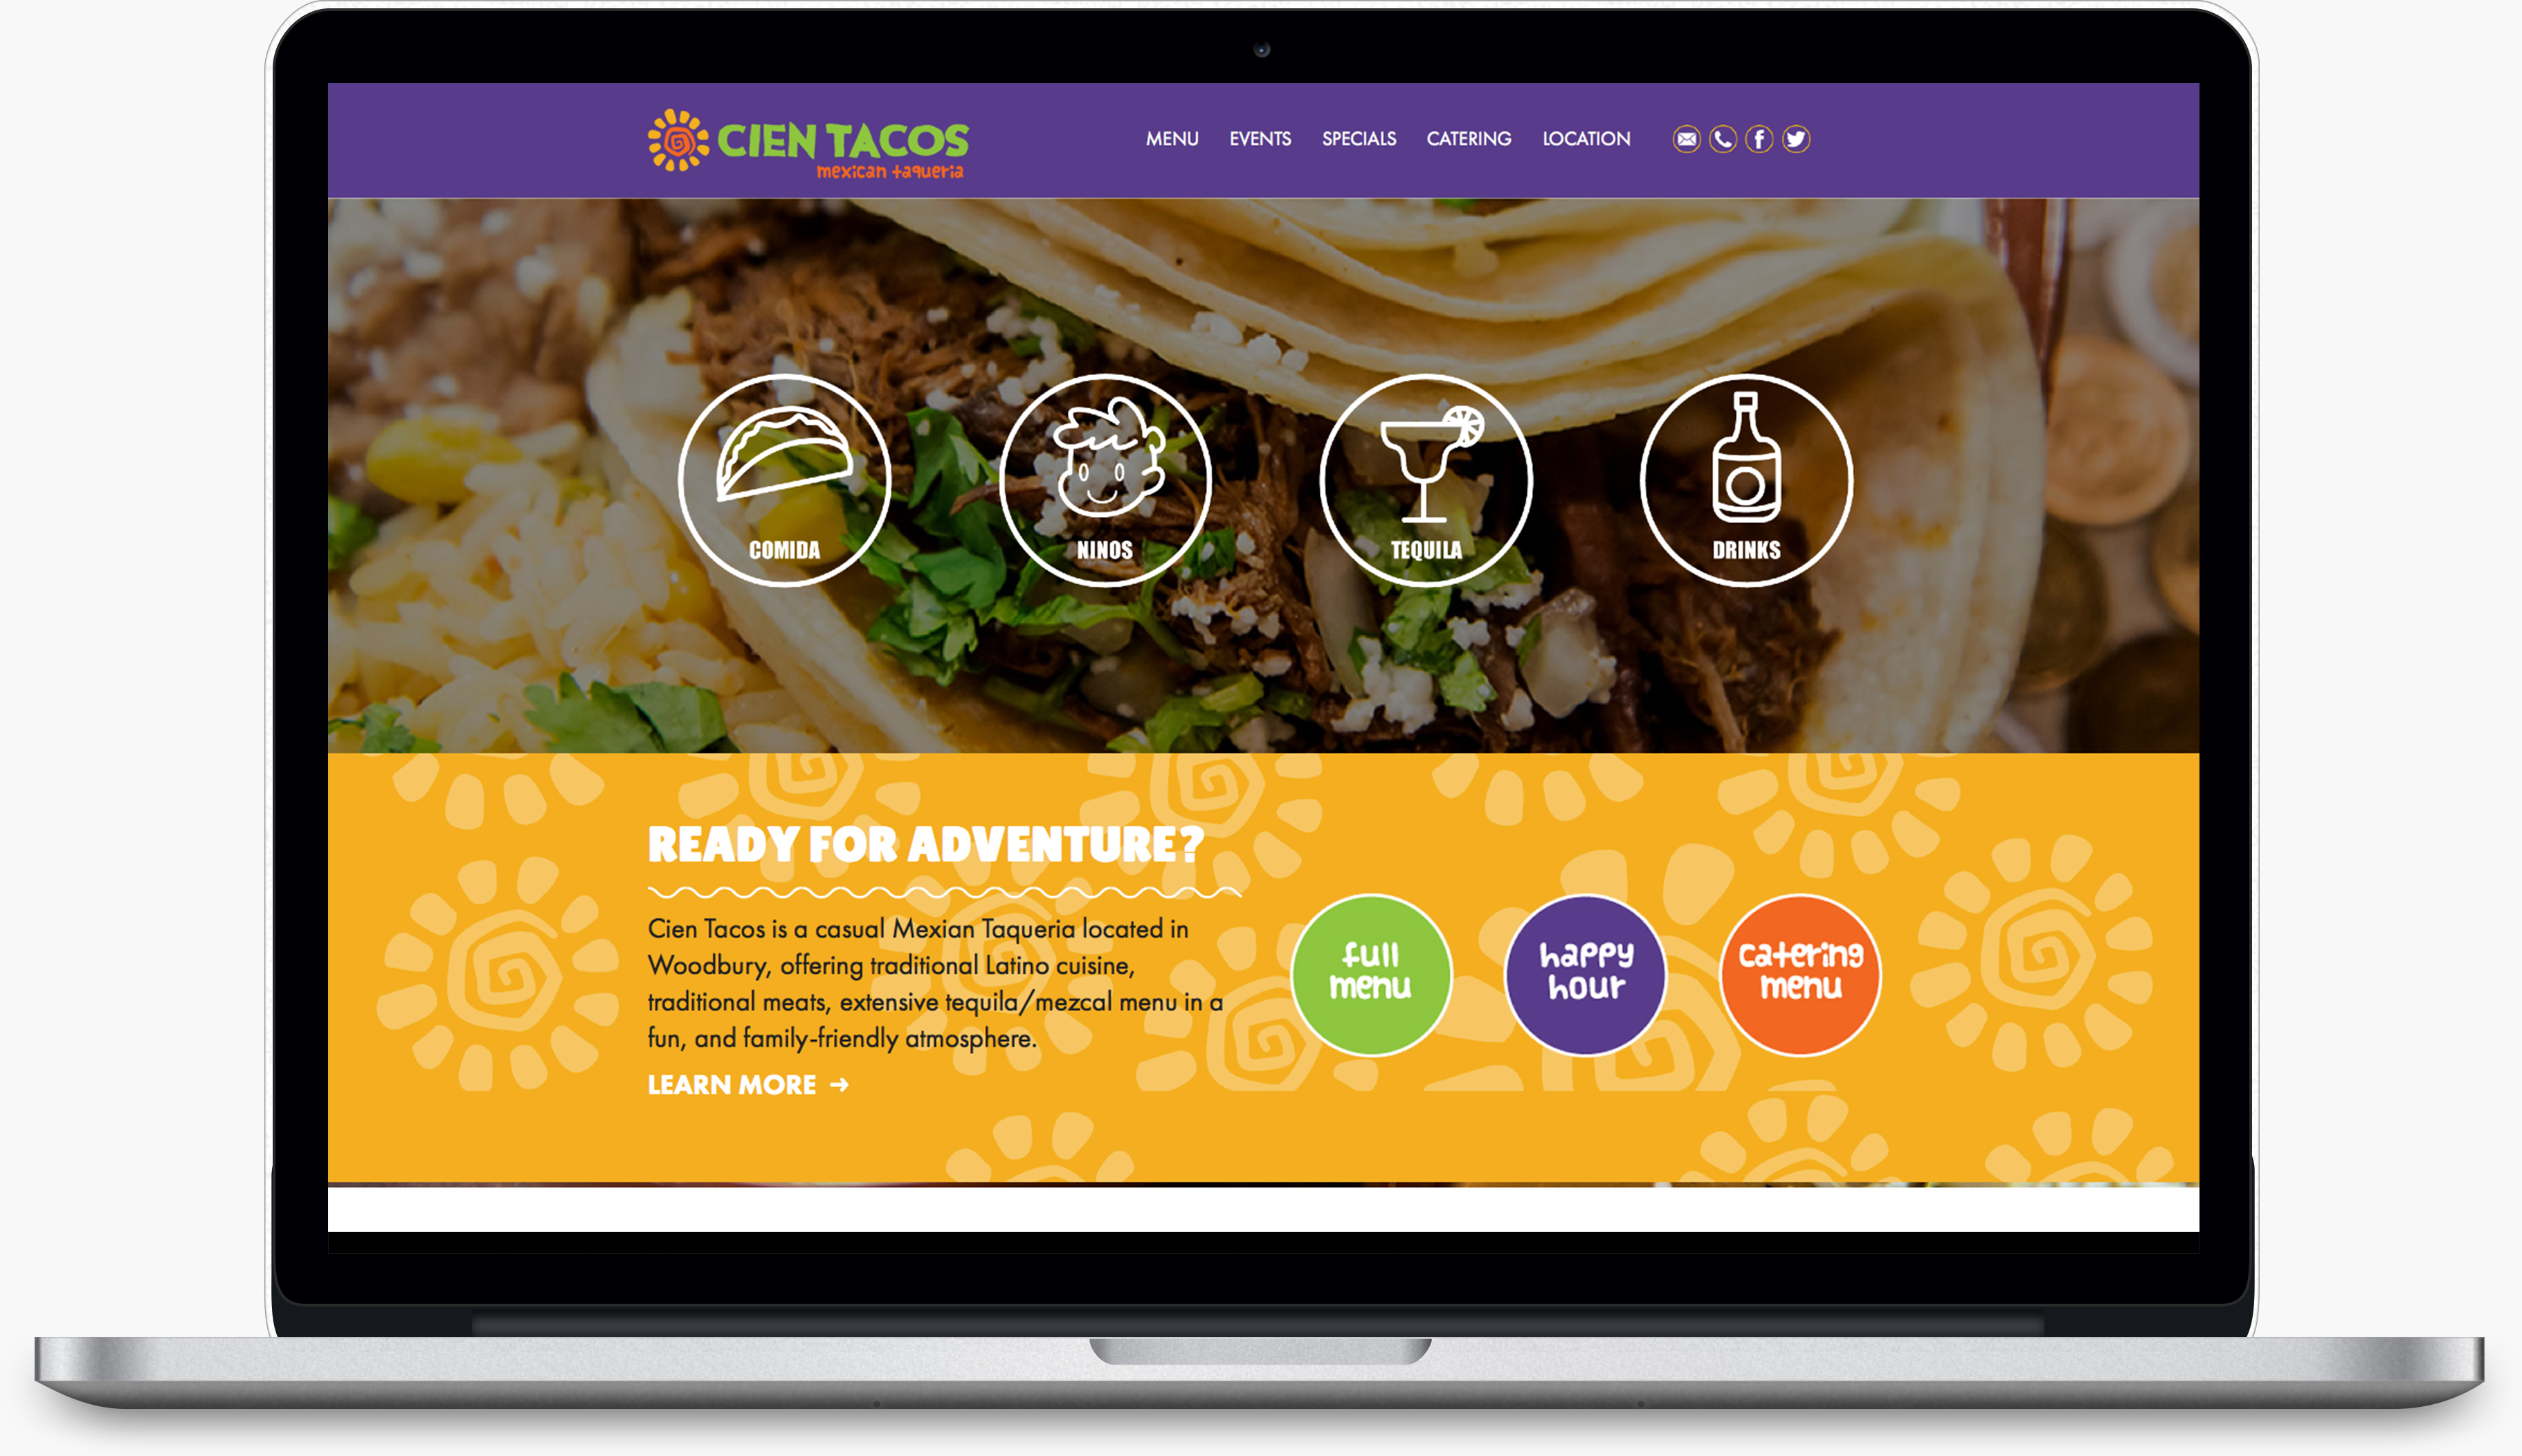
3) Websites.
Publishers who use infographics get 12% more web traffic than those who don’t.
If your customers are heading to your website to learn more about you, there’s probably a few key points you want them to walk away with. Users typically only have time to read about 28% of your website content, which means they’re not getting the full story.
The brain can process visuals up to 60,000 times faster.
Most website’s have a ton of text, and your audience has to sift through to find the information they want. Surprise them with an infographic on a few of your pages. Give them the information they want while also standing out from competitors. They’re likely to remember a visual breakdown of your company rather than the three paragraphs of text on a competitor’s website.
4) Get social.
 45% more web users click on a link if it features an infographic.
If you type “infographic” into Pinterest, the content is endless. People love to see their favorite subjects broken down into digestible and entertaining visuals. This also means that it’s more likely to be viewed and even shared. Specifically, it’s 30 times more likely to be read than a purely textual article!
There’s also more potential for infographics to go viral. They are more interesting than a regular status update or image, and they’re easily brand-able. When more people share your branded infographic, that means you’re getting more brand exposure.
5) Presentations.
67% of the audience is persuaded by the verbal presentation that has accompanying visuals.
 Most people dread creating presentations. We have worked on a variety of infographic style presentations for small business to Fortune 500 companies to bring their content to life in a fun and unique way. We transform the most mundane topics into a visual story, that pulls the audience in and shows them the key points quickly. Let your information speak for itself, and you can stop stressing that the boss looks like he’s going to fall asleep!
Why DreamBig?
We work relentlessly to understand each client’s brand and goals, as well as the topic of their infographic. We believe in bringing out a personality in each graphic, and our team works with clients to try new approaches and to create something out of the box. We have a passion for our craft, but also a passion for our clients. Our visual designs are bold, beautiful, and colorful – we never stop having fun when it comes to perfecting a project.
DreamBig has extensive experience designing infographics for a wide variety of companies and topics. To see more of our infographic design work visit our infographic portfolio.
If you’re interested in thinking outside of the box, don’t hesitate to contact us about creating an infographic for your team. We’d love to hear what you’re thinking, and start crafting the perfect visual for your topic!


Recent Comments